
Extension:SparqlCharts
This extension is currently not actively maintained! Although it may still work, any bug reports or feature requests will more than likely be ignored. |
Release status: unmaintained |
|
|---|---|
| Implementation | Parser function, Data extraction, Special page |
| Description | Allows to query SPARQL endpoints and display query results in different formats |
| Author(s) | Oliver Lutzi, Marvin Ruchay |
| Latest version | 0.1 (2016-02-29) |
| MediaWiki | 1.25+ |
| PHP | 5.5+ |
| Database changes | No |
| License | GNU General Public License 3.0 or later |
| Download | GitHub: Note: |
The SparqlCharts extension allows to query SPARQL endpoints and display the query result in different formats.
Download
[edit]You can download the extension here.
Installation
[edit]- Unzip the downloaded zip file.
- The downloaded file will contain a folder called SparqlCharts-master. Rename it to SparqlCharts and put it into your wikis extension folder.
- Include the following line at the end of your LocalSettings.php:
wfLoadExtension( 'SparqlCharts' );
- You can use the extension now! (There are no other extensions required as prerequisites and there is no setup procedure needed.)
Basic Usage
[edit]After successful installation, you can execute a SPARQL query and display the results of that query by using the following pattern:
{{#sparqlcharts:
QUERY
|endpoint=ENDPOINT
}}
In the pattern, replace QUERY with your SPARQL query and ENDPOINT with the endpoint you want to send your query to. A simple query could look like this:
{{#sparqlcharts:
PREFIX rdf: <http://www.w3.org/1999/02/22-rdf-syntax-ns#>
PREFIX dbo: <http://dbpedia.org/ontology/>
SELECT ?country
WHERE {
  ?country rdf:type dbo:Country.
} LIMIT 10
|endpoint = http://dbpedia.org/sparql
}}
Since we did not define a format by setting the format parameter, the query result gets displayed as the default format, which is a table. To display the results in a format other than a table, add the line |format=FORMAT and replace FORMAT by any value listed below. Each format provides several parameters to change the chart's visual appearance such as |height=HEIGHT or |color=COLOR. There are also parameters to select which parts of the result table of the SPARQL query should get displayed in the chart, explained here.
Formats
[edit]Simple Bar Chart
[edit]Click on "Expand" to see details about this format.

{{#sparqlcharts:
QUERY
|format        = barchart
|endpoint      = ADDRESS_OF_SPARQL_ENDPOINT
|defaulturi    = URI_OF_RDF_GRAPH_TO_QUERY_AGAINST
|width         = WIDTH_OF_CHART_IN_PIXELS (default=600)
|height        = HEIGHT_OF_CHART_IN_PIXELS (default=350)
|color         = COLOR_OF_BARS (default=steelblue)
|xaxis         = RESULT_VAR_OF_SPARQL_QUERY_USED_FOR_XAXIS
|yaxis         = RESULT_VAR_OF_SPARQL_QUERY_USED_FOR_YAXIS
|tooltipvar1   = RESULT_VAR_OF_SPARQL_QUERY_USED_FOR_TOOLTIP1
|tooltiplabel1 = LABEL_FOR_TOOLTIP1
|tooltipvar2   = RESULT_VAR_OF_SPARQL_QUERY_USED_FOR_TOOLTIP2
|tooltiplabel2 = LABEL_FOR_TOOLTIP2
}}
Mandatory parameters: format, endpoint.
Used JavaScript library: D3.js[1]. Format is based on this guide.
The list of supported named colors is specified by CSS.
See here for an explanation of the parameters xaxis, yaxis, tooltipvar1, tooltipvar2, etc. and tooltiplabel1, tooltiplabel2 etc.
Click on "Expand" to see an example of the "bar chart" format.

The chart depicted in this screenshot has been created by the following code:
{{#sparqlcharts:
PREFIX owl: <http://www.w3.org/2002/07/owl#>
PREFIX xsd: <http://www.w3.org/2001/XMLSchema#>
PREFIX rdfs: <http://www.w3.org/2000/01/rdf-schema#>
PREFIX rdf: <http://www.w3.org/1999/02/22-rdf-syntax-ns#>
PREFIX dbo: <http://dbpedia.org/ontology/>
PREFIX dbp: <http://dbpedia.org/property/>
PREFIX dbr: <http://dbpedia.org/resource/>
SELECT
  (SAMPLE(?season) as ?season)
  ?year
  (SAMPLE (?totalGoals) as ?totalGoals)
  (SAMPLE (?winner_label) as ?winner_label)
  (SAMPLE (?topScorer_label) as ?topScorer_label)
WHERE {
  ?season rdf:type dbo:FootballLeagueSeason.
  ?season dbp:nextseason ?year FILTER(?year > 2006 && ?year <2015).
  ?season dbp:competition dbr:Bundesliga.
  ?season dbp:totalGoals ?totalGoals .
  ?season dbp:leagueTopscorer ?topScorer.
  ?topScorer rdfs:label ?topScorer_label FILTER langMatches( lang(?topScorer_label), "EN" ).
  ?season dbp:winners ?winner.
  ?winner rdf:type owl:Thing.
  ?winner rdfs:label ?winner_label  FILTER langMatches( lang(?winner_label), "EN" ).
}
GROUP BY (?year)
ORDER BY ?year

|format=barchart
|endpoint=http://dbpedia.org/sparql

|xaxis=?year
|yaxis=?totalGoals
|xaxislabel=Bundesliga-Season
|yaxislabel=Total goals
|tooltipvar1= ?winner_label
|tooltiplabel1 = Winner
|tooltipvar2= ?topScorer_label
|tooltiplabel2 = Top scorer
}}
Multi-Bar Chart
[edit]Click on "Expand" to see details about this format.


{{#sparqlcharts:
QUERY
|format             = stackedmultibarchart
|endpoint           = ADDRESS_OF_SPARQL_ENDPOINT
|defaulturi         = URI_OF_RDF_GRAPH_TO_QUERY_AGAINST
|width              = WIDTH_OF_CHART_IN_PIXELS (default=500)
|height             = HEIGHT_OF_CHART_IN_PIXELS (default=300)
|xaxislabel         = LABEL_FOR_XAXIS (default=x-axis)
|yaxislabel         = LABEL_FOR_YAXIS (default=y-axis)
|rotatex            = ROTATION_OF_XAXIS_VALUES (default=0)
|xaxislabeldistance = DISTANCE_BETWEEN_XAXIS_AND_XAXIS_LABEL (default=0)
|yaxislabeldistance = DISTANCE_BETWEEN_YAXIS_AND_YAXIS_LABEL (default=0)
|margintop          = PIXELS_ABOVE_TOP_OF_YAXIS (default=10)
|marginbottom       = PIXELS_BENEATH_BOTTOM_OF_YAXIS (default=80)
|marginright        = PIXELS_NEXT_TO_RIGHT_END_OF_XAXIS (default=10)
|marginright        = PIXELS_NEXT_TO_LEFT_END_OF_XAXIS (default=80)
|groupspacing       = PADDING_BETWEEN_BAR_GROUPS (default=0.2)
|xaxis              = RESULT_VAR_OF_SPARQL_QUERY_USED_FOR_XAXIS
|yaxis              = RESULT_VAR_OF_SPARQL_QUERY_USED_FOR_YAXIS
|zaxis              = RESULT_VAR_OF_SPARQL_QUERY_USED_FOR_KEYS_IN_LEGEND
}}
Mandatory parameters: format, endpoint.
Used JavaScript libraries: D3.js[1], NVD3.js[2]
See here for an explanation of the parameters xaxis, yaxis and zaxis.
Click on "Expand" to see an example of the "mulit-bar chart" format.


The chart depicted in this screenshots has been created by the following code:
{{#sparqlcharts:
PREFIX xsd: <http://www.w3.org/2001/XMLSchema#>
PREFIX rdfs: <http://www.w3.org/2000/01/rdf-schema#>
PREFIX dbo: <http://dbpedia.org/ontology/>
PREFIX dbp: <http://dbpedia.org/property/>
PREFIX dbr: <http://dbpedia.org/resource/>
SELECT
  ?club_label
  ?year
  (SUM(?attendance) AS ?total_attendance)
WHERE {
  ?seasonOfTeam dbp:club ?club.
  ?club dbo:league dbr:Premier_League.
  ?seasonOfTeam dbp:season ?year.
  ?seasonOfTeam dbp:league dbr:Premier_League.
  ?seasonOfTeam dbp:attendance ?attendance.
  ?club rdfs:label ?club_label FILTER langMatches( lang(?club_label), "EN" ).
  FILTER ( datatype(?attendance) = xsd:integer )
  FILTER ( ?year = 2011 {{!}}{{!}}
    ?year = 2012 {{!}}{{!}}
    ?year = 2013 {{!}}{{!}}
    ?year = 2014)
  FILTER (
  ?seasonOfTeam = <http://dbpedia.org/resource/2011%E2%80%9312_Chelsea_F.C._season> {{!}}{{!}}
  ?seasonOfTeam = <http://dbpedia.org/resource/2012%E2%80%9313_Chelsea_F.C._season> {{!}}{{!}}
  ?seasonOfTeam = <http://dbpedia.org/resource/2013%E2%80%9314_Chelsea_F.C._season> {{!}}{{!}}
  ?seasonOfTeam = <http://dbpedia.org/resource/2014%E2%80%9315_Chelsea_F.C._season> {{!}}{{!}}
  ?seasonOfTeam = <http://dbpedia.org/resource/2011%E2%80%9312_West_Bromwich_Albion_F.C._season> {{!}}{{!}}
  ?seasonOfTeam = <http://dbpedia.org/resource/2012%E2%80%9313_West_Bromwich_Albion_F.C._season> {{!}}{{!}}
  ?seasonOfTeam = <http://dbpedia.org/resource/2013%E2%80%9314_West_Bromwich_Albion_F.C._season> {{!}}{{!}}
  ?seasonOfTeam = <http://dbpedia.org/resource/2014%E2%80%9315_West_Bromwich_Albion_F.C._season> {{!}}{{!}}
  ?seasonOfTeam = <http://dbpedia.org/resource/2011%E2%80%9312_Swansea_City_A.F.C._season> {{!}}{{!}}
  ?seasonOfTeam = <http://dbpedia.org/resource/2012%E2%80%9313_Swansea_City_A.F.C._season> {{!}}{{!}}
  ?seasonOfTeam = <http://dbpedia.org/resource/2013%E2%80%9314_Swansea_City_A.F.C._season> {{!}}{{!}}
  ?seasonOfTeam = <http://dbpedia.org/resource/2014%E2%80%9315_Swansea_City_A.F.C._season> {{!}}{{!}}
  ?seasonOfTeam = <http://dbpedia.org/resource/2011%E2%80%9312_Newcastle_United_F.C._season> {{!}}{{!}}
  ?seasonOfTeam = <http://dbpedia.org/resource/2012%E2%80%9313_Newcastle_United_F.C._season> {{!}}{{!}}
  ?seasonOfTeam = <http://dbpedia.org/resource/2013%E2%80%9314_Newcastle_United_F.C._season> {{!}}{{!}}
  ?seasonOfTeam = <http://dbpedia.org/resource/2014%E2%80%9315_Newcastle_United_F.C._season> {{!}}{{!}}
  ?seasonOfTeam = <http://dbpedia.org/resource/2011%E2%80%9312_Arsenal_F.C._season> {{!}}{{!}}
  ?seasonOfTeam = <http://dbpedia.org/resource/2012%E2%80%9313_Arsenal_F.C._season> {{!}}{{!}}
  ?seasonOfTeam = <http://dbpedia.org/resource/2013%E2%80%9314_Arsenal_F.C._season> {{!}}{{!}}
  ?seasonOfTeam = <http://dbpedia.org/resource/2014%E2%80%9315_Arsenal_F.C._season>)
}
GROUP BY ?club_label ?year
ORDER BY ?year

|format=stackedmultibarchart
|endpoint=http://dbpedia.org/sparql
|xaxis = ?club_label
|yaxis = ?total_attendance
|zaxis = ?year
|rotatex = -45
|xaxislabel = Season
|yaxislabel =  Total attendance
|xaxislabeldistance = 30
|yaxislabeldistance = 30
|marginleft = 100
|marginbottom = 150
|width=3
|height=1
}}
Pie Chart / Donut Chart
[edit]Click on "Expand" to see details about this format.


{{#sparqlcharts:
QUERY
|format               = piechart
|endpoint             = ADDRESS_OF_SPARQL_ENDPOINT
|defaulturi           = URI_OF_RDF_GRAPH_TO_QUERY_AGAINST
|xaxis                = RESULT_VAR_OF_SPARQL_QUERY_USED_FOR_XAXIS
|yaxis                = RESULT_VAR_OF_SPARQL_QUERY_USED_FOR_YAXIS
|width                = WIDTH_OF_CHART_IN_PIXELS (default=600)
|height               = HEIGHT_OF_CHART_IN_PIXELS (default=350)
|showlabels           = ON_OFF_SWITCH_FOR_LABELS (default=true)
|labeltype            = TYPE_OF_LABELS (default=percent; others: key, value)
|valueformat          = FORMAT_OF_LABEL_TYPE_VALUE (default=,.0f)
|labelthreshold       = THRESHOLD_OF_SLICE_TO_DISPLAY_LABEL (default=0.1)
|labelsoutside        = ON_OFF_SWITCH_FOR_POSITIONING_LABELS_OUTSIDE (default=false)
|sunbeamlayout        = ON_OFF_SWITCH_FOR_SUNBEAM_LAYOUT (default=false)
|donut                = ON_OFF_SWITCH_FOR_DONUT_FORMAT (default=false)
|donuttitle           = TITLE_DISPLAYED_IN_THE_MIDDLE_OF_THE_DONUT (default= )
|spacingbetweenslices = SPACING_BETWEEN_SLICES_IN_PERCENT (default=0)
}}
Mandatory parameters: format, endpoint. (Note: For using the donut chart, you need to set |donut=true. As per default, this format is a pie chart.)
Used JavaScript libraries: D3.js[1], NVD3.js[2]
The possible values for the parameter valueformat are listed here.
See here for an explanation of the parameters xaxis and yaxis.
Click on "Expand" to see an example of the "donut chart" format.
The chart depicted in this screenshot has been created by the following code:
{{#sparqlcharts:
PREFIX rdf: <http://www.w3.org/1999/02/22-rdf-syntax-ns#>
PREFIX rdfs: <http://www.w3.org/2000/01/rdf-schema#>
PREFIX dbo: <http://dbpedia.org/ontology/>
PREFIX dbr: <http://dbpedia.org/resource/>
PREFIX yago: <http://dbpedia.org/class/yago/>
SELECT distinct
  ?country_uri
  ?country_label
  ?value
WHERE {
  ?country_uri rdf:type yago:StatesOfGermany.
  ?country_uri rdfs:label ?country_label FILTER langMatches( lang(?country_label), "EN" ).
  ?country_uri <http://dbpedia.org/property/votes> ?value.
}

|format = piechart
|endpoint = http://live.dbpedia.org/sparql

|xaxis=?country_label
|yaxis=?value

|width=600
|height=600

|showlabels=true
|labelthreshold=0.05
|labelsoutside=true
|sunbeamlayout=true
|donut=true
|donuttitle=German Bundestag
|spacingbetweenslices=0.05

}}
Simple Line Chart
[edit]Click on "Expand" to see details about this format.

{{#sparqlcharts:
QUERY
|format             = linechart
|endpoint           = ADDRESS_OF_SPARQL_ENDPOINT
|defaulturi         = URI_OF_RDF_GRAPH_TO_QUERY_AGAINST
|width              = WIDTH_OF_CHART_IN_PIXELS (default=600)
|height             = HEIGHT_OF_CHART_IN_PIXELS (default=350)
|color              = COLOR_OF_LINE (default=steelblue)
|xaxislabel         = LABEL_FOR_XAXIS (default=x-axis)
|yaxislabel         = LABEL_FOR_YAXIS (default=y-axis)
|margintop          = PIXELS_ABOVE_TOP_OF_YAXIS (default=10)
|marginbottom       = PIXELS_BENEATH_BOTTOM_OF_YAXIS (default=80)
|marginright        = PIXELS_NEXT_TO_RIGHT_END_OF_XAXIS (default=20)
|marginright        = PIXELS_NEXT_TO_LEFT_END_OF_XAXIS (default=80)
|xaxis              = RESULT_VAR_OF_SPARQL_QUERY_USED_FOR_XAXIS
|yaxis              = RESULT_VAR_OF_SPARQL_QUERY_USED_FOR_YAXIS
}}
Mandatory parameters: format, endpoint.
Used JavaScript libraries: D3.js[1], NVD3.js[2]
The list of supported named colors is specified by CSS.
See here for an explanation of the parameters xaxis and yaxis.
Click on "Expand" to see an example of the "simple line-chart" format.
The chart depicted in this screenshot has been created by the following code:
{{#sparqlcharts:
PREFIX xsd: <http://www.w3.org/2001/XMLSchema#>
PREFIX rdfs: <http://www.w3.org/2000/01/rdf-schema#>
PREFIX rdf: <http://www.w3.org/1999/02/22-rdf-syntax-ns#>
PREFIX dbo: <http://dbpedia.org/ontology/>
PREFIX dbp: <http://dbpedia.org/property/>
PREFIX dbr: <http://dbpedia.org/resource/>
SELECT
  ?season ?year ?totalGoals
WHERE {
  ?season rdf:type dbo:FootballLeagueSeason.
  ?season dbp:nextseason ?year.
  ?season dbp:competition dbr:Bundesliga.
  ?season dbp:totalGoals ?totalGoals .
}
ORDER BY ?year

|format=linechart
|endpoint=http://dbpedia.org/sparql
|xaxis=?year
|yaxis=?totalGoals
|xaxislabel=Bundesliga season
|yaxislabel=scored goals
}}
Stacked Area Chart
[edit]Click on "Expand" to see details about this format.


{{#sparqlcharts:
QUERY
|format             = stackedareachart
|endpoint           = ADDRESS_OF_SPARQL_ENDPOINT
|defaulturi         = URI_OF_RDF_GRAPH_TO_QUERY_AGAINST
|width              = WIDTH_OF_CHART_IN_PIXELS (default=500)
|height             = HEIGHT_OF_CHART_IN_PIXELS (default=300)
|margintop          = PIXELS_ABOVE_TOP_OF_YAXIS (default=10)
|marginbottom       = PIXELS_BENEATH_BOTTOM_OF_YAXIS (default=80)
|marginright        = PIXELS_NEXT_TO_RIGHT_END_OF_XAXIS (default=10)
|marginright        = PIXELS_NEXT_TO_LEFT_END_OF_XAXIS (default=80)
|xaxis              = RESULT_VAR_OF_SPARQL_QUERY_USED_FOR_XAXIS
|yaxis              = RESULT_VAR_OF_SPARQL_QUERY_USED_FOR_YAXIS
|zaxis              = RESULT_VAR_OF_SPARQL_QUERY_USED_FOR_KEYS_IN_LEGEND
}}
Mandatory parameters: format, endpoint.
Used JavaScript libraries: D3.js[1], NVD3.js[2]
See here for an explanation of the parameters xaxis, yaxis and zaxis.
Click on "Expand" to see an example of the "stacked-area chart" format.


The chart depicted in this screenshots has been created by the following code:
{{#sparqlcharts:
PREFIX xsd: <http://www.w3.org/2001/XMLSchema#>
PREFIX rdfs: <http://www.w3.org/2000/01/rdf-schema#>
PREFIX rdf: <http://www.w3.org/1999/02/22-rdf-syntax-ns#>
PREFIX dbo: <http://dbpedia.org/ontology/>
PREFIX dbp: <http://dbpedia.org/property/>
PREFIX dbr: <http://dbpedia.org/resource/>
SELECT
  ?club_label
  ?year
  (AVG(?attendance) AS ?total_attendance)
WHERE {
  ?seasonOfTeam dbp:club ?club.
  ?club dbo:league dbr:Premier_League.
  ?club rdfs:label ?club_label FILTER langMatches( lang(?club_label), "EN" ).
  ?seasonOfTeam dbp:season ?year.
  ?seasonOfTeam dbp:league dbr:Premier_League.
  ?seasonOfTeam dbp:attendance ?attendance.
  FILTER ( datatype(?attendance) = xsd:integer )
}
GROUP BY ?club_label ?year
ORDER BY ?year

|format=stackedareachart
|endpoint=http://dbpedia.org/sparql
|xaxis=?year
|yaxis=?total_attendance
|zaxis=?club_label
|width=3
|height=1
}}
Boxplot
[edit]Click on "Expand" to see details about this format.

{{#sparqlcharts:
QUERY
|format        = boxplot
|endpoint      = ADDRESS_OF_SPARQL_ENDPOINT
|defaulturi    = URI_OF_RDF_GRAPH_TO_QUERY_AGAINST
|width         = WIDTH_OF_CHART_IN_PIXELS (default=800)
|height        = HEIGHT_OF_CHART_IN_PIXELS (default=400)
|xaxislabel    = LABEL_FOR_XAXIS (default=x-axis)
|yaxislabel    = LABEL_FOR_YAXIS (default=y-axis)
|caption       = CAPTION_OF_BOXPLOT (default= )
|outlier       = ON_OFF_SWITCH_FOR_OUTLIERS (default=0, 0=off, 1=on)
|boxplot1      = RESULT_VAR_OF_SPARQL_QUERY_USED_FOR_BOXPLOT1
|boxplot1_name = NAME_OF_BOXPLOT1_DISPLAYED_ON_XAXIS
|boxplot2      = RESULT_VAR_OF_SPARQL_QUERY_USED_FOR_BOXPLOT2
|boxplot2_name = NAME_OF_BOXPLOT2_DISPLAYED_ON_XAXIS
}}
Mandatory parameters: format, endpoint.
Used JavaScript libraries: D3.js[1]. Format is based on this template.
See here for an explanation of the parameters boxplot1, boxplot2, etc. and boxplot1_name, boxplot2_name etc.
Click on "Expand" to see an example of the "bar chart" format.
The chart depicted in this screenshot has been created by the following code:
{{#sparqlcharts:
SELECT ?height1 ?height2 ?height3 WHERE {
  ?player a <http://dbpedia.org/ontology/SoccerPlayer> .
  {
    {?player <http://dbpedia.org/ontology/team> <http://dbpedia.org/resource/FC_Bayern_Munich>.}
    UNION
    {?player <http://dbpedia.org/property/clubs> <http://dbpedia.org/resource/FC_Bayern_Munich>.}
    ?player <http://dbpedia.org/ontology/Person/height> ?height1 .
    FILTER(xsd:integer(?height1) > 0)
    FILTER(xsd:integer(?height1) > 120)
    FILTER(xsd:integer(?height1) < 220)
  }
  UNION
  {
    ?player <http://dbpedia.org/ontology/team> <http://dbpedia.org/resource/FC_Barcelona>.
    ?player <http://dbpedia.org/ontology/Person/height> ?height2 .
    FILTER(xsd:integer(?height2) > 0)
    FILTER(xsd:integer(?height2) > 120)
    FILTER(xsd:integer(?height2) < 220)
  }
  UNION
    {
    ?player <http://dbpedia.org/ontology/team> <http://dbpedia.org/resource/Arsenal_F.C.>.
    ?player <http://dbpedia.org/ontology/Person/height> ?height3 .
    FILTER(xsd:integer(?height3) > 0)
    FILTER(xsd:integer(?height3) > 120)
    FILTER(xsd:integer(?height3) < 220)
   }
}
|format=boxplot
|endpoint=http://dbpedia.org/sparql
|outlier=1
|boxplot1=?height2
|boxplot2=?height3
|boxplot1_name=FC Barcelona
|boxplot2_name=Arsenal F.C.
|boxplot3_name=FC Bayern Munich
|xaxislabel=football team
|yaxislabel=height of the players in cm
|caption=Height of the players of Barcelona, Bayern und Arsenal in cm
}}
Force Directed Graph
[edit]Click on "Expand" to see details about this format.

{{#sparqlcharts:
QUERY
|format        = forcedirectedgraph
|endpoint      = ADDRESS_OF_SPARQL_ENDPOINT
|defaulturi    = URI_OF_RDF_GRAPH_TO_QUERY_AGAINST
|width         = WIDTH_OF_CHART_IN_PIXELS (default=600)
|height        = HEIGHT_OF_CHART_IN_PIXELS (default=400)
|subject       = VERTEX_THAT_IS_TAIL_OF_EDGE_IN_GRAPH
|object        = VERTEX_THAT_IS_HEAD_OF_EDGE_IN_GRAPH
|group_subj    = GROUP_OF_TAIL
|group_obj     = GROUP_OF_HEAD
}}
Mandatory parameters: format, endpoint.
Used JavaScript libraries: D3.js[1]. Format is based on this template.
See here for an explanation of the parameters subject, object, etc. and group_subj, group_obj.
Click on "Expand" to see an example of the "force directed graph" format.
The chart depicted in this screenshot has been created by the following code:
{{#sparqlcharts:
PREFIX rdf: <http://www.w3.org/1999/02/22-rdf-syntax-ns#>
PREFIX rdfs: <http://www.w3.org/2000/01/rdf-schema#>
PREFIX dbo: <http://dbpedia.org/ontology/>
PREFIX dbr: <http://dbpedia.org/resource/>
PREFIX yago: <http://dbpedia.org/class/yago/>
SELECT
  ?country_label ?organization ?group_subj ?group_obj
WHERE {
  ?country_uri rdf:type ?organization.
  ?country_uri rdf:type ?group_subj FILTER(?group_subj = dbo:Country).
  ?country_uri rdfs:label ?country_label FILTER langMatches( lang(?country_label), "EN" ).
  ?organization rdfs:subClassOf ?group_obj FILTER(?group_obj = yago:Country108544813).
  FILTER(
    ?organization = yago:MemberStatesOfNATO {{!}}{{!}}
    ?organization = yago:CountriesBorderingTheAtlanticOcean
  )
}
LIMIT 100

|format = forcedirectedgraph
|endpoint   = http://dbpedia.org/sparql
|width      = 800
|height     = 800
|subject = ?country
|object = ?organization
|group_subj = ?group_subj
|group_obj = ?group_obj
}}
Parameters to chose displayed parts of the SPARQL result table
[edit]Every format has certain parameters to select the very parts from the SPARQL query's result table that should be displayed in the chart.
Parameters xaxis, yaxis, zaxis
[edit]Let be the result table of the SPARQL query with rows and columns and let be the cell of in row and column . Most of the chart formats display a set of 2-tuples[3] of the form , which means every element of one tuple corresponds to the same row in the table. With the parameter xaxis you can chose the column for the first element of the 2-tuple by setting the xaxis parameter to the name of the SPARQL query's result variable that corresponds to the column .


![{\displaystyle [t(a,x);t(a,y)]}](https://wikimedia.org/api/rest_v1/media/math/render/svg/7a0d65f477b9098d2673ab9d7f41ac0d2de86368)

For the bar chart format, as shown in the image below, every bar corresponds to a 2-tuple, where the first element of the tuple becomes the x-axis value of the bar, representing the "name" of the bar, and the second element becomes the y-axis value, representing the height of the bar (hence the naming of the parameters).
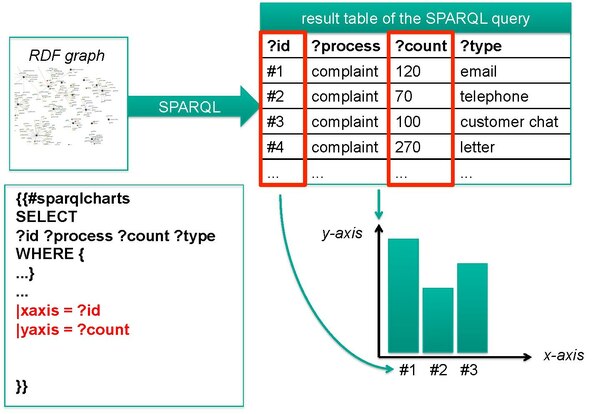
The charts listed in the table all work after this logic. Not all chart formats display sets of 2-tuples. The multi-bar chart and the stacked area chart are displaying 3-tuples and therefore need a third parameter: zaxis.
xaxis |
yaxis |
zaxis
| |
|---|---|---|---|
| bar chart | name of bars on x-axis | height of bars (=y-axis value) | - |
| line chart | x-axis values of data point | y-axis values of data points | - |
| pie chart | name of slices | size of slices | - |
| multi-bar chart | name of bars on x-axis | height of bars (=y-axis value) | name of keys in legend
(one color for each key) |
| stacked area chart | x-axis values of data points | y-axis values of data points | name of keys in legend
(one color for each key) |
Parameters subject, object, group_subj, group_obj
[edit]The force directed graph does not display data tuples but a graph i.e. vertices and edges. Each row of the SPARQL query's result table represents one edge in the graph and its incident vertices. The parameter subject defines the column for the tail (starting point) of the edge and the parameter object defines the column for the head (end point) of the edge. The parameters group_subj (resp. group_obj) defines the group of the tail (resp. head). Different groups get displayed through different colors in the graph.
subject |
object |
group_subj |
group_obj
| |
|---|---|---|---|---|
| force directed graph | vertex, that is tail of the edge | vertex, that is head of the edge | group of tail | group of head |
Parameters boxplot1, boxplot2, etc. and boxplot1_name, etc.
[edit]In the boxplot format, every boxplot represents a group of numerical data. The data for one group is taken from a single column of the SPARQL query's result table so that one boxplot corresponds to one column of the table. With |boxplot1=?population you state that the first boxplot represents all values of he "?population"-column of the result table. With |boxplot1_name=Size of population you can set the title of boxplot1, which gets displayed on the x-axis.
Parameters tooltipvar1, tooltipvar2, etc. and tooltiplabel1, etc.
[edit]At the current state of implementation, you can only use the parameters tooltipvar1, tooltipvar2 etc. and respectively tooltiplabel1, tooltiplabel2 for the bar chart format.
A bar chart without a tooltip represents a set of 2-tuples as stated above. If you set the parameter tooltipvar1 to a variable of the SPARQL query's result table (a variable other than set by xaxis and yaxis) every bar represents a 2-tuple and the tooltip represents a further column of the result table. This makes a barchart with one element in the tooltip representing a set of 3-tuples. In the example, the column "?id" and "?count" get already displayed by the bar chart without tooltip. By setting |tooltipvar1=?type the values of the "?type"-column get displayed as a tooltip for the respective bars. |tooltiplabel1=complaint type simply sets a label that gets displayed in front of the value from the "?type"-column.

Querying own Wiki (with the help of Semantic MediaWiki)
[edit]If you use Semantic MediaWiki it is possible to synchronize your wikis data with a SPARQL endpoint (see here). By setting the endpoint parameter to the address of this endpoint, you can query for sites in your wiki or for the semantic properties.
Known issues
[edit]- [4] Filter statements in SPARQL that use the pipe symbol for logical OR statements (the || symbol) will not work with the MediaWiki parser. To fix this, you need to create a template, such as the Template:! which contains the pipe character, and then include this template within your queries.
- Will not work:
FILTER(?x = 3 || ?x = 4)
- Works:
filter(?x = 3 {{!}}{{!}} ?x = 4)
- Will not work:
- At the moment, text cannot be wrapped around the charts and the charts cannot be placed within a table.
Future development
[edit]Here is a list of some charts that could be added to the extension:
- The used NVD3 template for the "simple line chart" format provides the possibility to display multiple lines in one chart. This functionality has not been implemented in the extension yet but could be added easily.
- The "force directed graph" format only exploits a few functions provided by the used [D3-template]. The format could be enriched by multiple features, such as: Mouseover-features like highlighting adjacent vertices/subgraphs or showing tooltips; collapsing/expanding subgraphs; different shapes and sizes of vertices and edges, etc. (This is a good example for a more powerful implementation).
- NVD3 Scatter/Bubble Chart

NVD3 "scatter/bubble chart" format - NVD3 Multi-Line Chart with focus

NVD3 "multi-line chart with focus" format - NVD3 Horizontal Multi-Bar Chart

NVD3 "horizontal multi-bar chart" format


Credits
[edit]The idea of the SparqlCharts extension is based on the "SparqlExtension" by Alfredas Chmieliauskas, Chris Davis, which provides similiar functionality (and more). Other than the SparqlExtension, our extension does not use the Google Charts API but processes the charts locally.
References
[edit]- ↑ 1.0 1.1 1.2 1.3 1.4 1.5 1.6 D3 documentation: https://github.com/mbostock/d3/wiki/API-Reference
- ↑ 2.0 2.1 2.2 2.3 NVD3 documentation: https://github.com/mbostock/d3/wiki/API-Reference
- ↑ In mathematics, an n-tuple is a sequence (or ordered list) of n elements, where n is a non-negative integer. Tuples are usually written by listing the elements within parentheses "" and separated by commas; for example, denotes a 5-tuple. (See here)
- ↑ Description copied from here

