
Extension:EasyTimeline/syntax
The EasyTimeline feature produces an embedded image from wikitext. The image can be a one-dimensional diagram (horizontally or vertically), or a two-dimensional one. The name "EasyTimeline" refers to the possibility to apply the feature with a time scale horizontally or vertically, possibly with another parameter in the other direction, but there are also various other possiblities.
Introduction[edit]
Graphical timelines can be produced by providing a script between special tags:
<timeline>
script
</timeline>
EasyTimeline will then be invoked to render a PNG image and (optionally) a clickable map.
Disclaimer: Even though EasyTimeline is designed for ease of use, a complicated graphical timeline is a non-trivial affair. A simple timeline may take half an hour to compose (or even more, when a suitable example is taken as a basis). Large timelines may take a few hours for composition and fine-tuning. However, adding to or correcting a timeline, no matter how complex, should be a relatively straightforward affair, even for contributors who have no expert knowledge of the syntax described here.
Feel free to ask the author of EasyTimeline for advice.
Available commands[edit]
The script commands define:
- Overall layout: ImageSize, PlotArea, Colors, BackgroundColors, AlignBars
- Interpretation and presentation of dates and periods: DateFormat, Period, ScaleMajor, ScaleMinor, TimeAxis
- Shorthands for pieces of script code that occur multiple times: Define
- How to order, divide, and name groups of events and periods: BarData, Legend, LineData
- Events, periods and descriptive texts: PlotData, TextData
General coding rules[edit]
A script can contain commands and comments. Each command is followed by one or more attributes.
Letter case: Commands and their attributes can be written in lower, upper or mixed case. Please try to be consistent in applying case as this will further readability, e.g. use mixed case for all commands and lowercase for all attributes.
The following commands are mandatory:
- ImageSize, determines the overall size of the time line
- PlotArea, determines the margins
- Period, determines the time period that will be displayed in the chart
- TimeAxis, the orientation (horizontal/vertical) of the time axis
At least one of the following commands is required (either or both can occur multiple times):
All other commands are optional.
Comments[edit]
Single and multi line comments can be specified:
- Text following the hash sign # will be regarded as a comment
- Text between #> and <# will also be regarded as a comment. Comments can span multiple lines, when tagged this way.
Examples:
DateFormat = dd/mm/yyyy # European date format

Period = from:01/09/1939 till:02/09/1945 #> this chart will show
  the complete duration of World War II <#
Commands[edit]
Commands should start on the first position of a line.
Some commands can be followed by multiple lines of data and/or options. These extra lines should start with at least one space or be completely empty (the latter is useful for visually grouping related data lines).
Commands have one of the following forms, depending on the type of command:
Command = attribute(s)
DateFormat = dd/mm/yyyy
Command name = attribute(s)
Define $US = text:"United States"
Command =
- attribute(s)
- attribute(s)
- etc.
PlotData =
  fontsize:XS width:20
  bar:Japan from:start till:19/02/1945 color:JT
  bar:Japan from:19/02/1945 till:14/03/1945 color:AI
Attributes[edit]
When several attributes can be specified for a certain command, they are notated as 'name:value' pairs. When several values can be specified for one attribute they have to be enclosed between parentheses. A few commands, like Color, use other formats.
Examples:
BackgroundColors = bars:darkgrey
PlotData = at:5 shift:(10, -7) text:Foo
Color SB = value:rgb(0.8,0,0.7) legend:Sea_Battles
Parameters vs data items[edit]
Most commands only accept attributes that are specified on the same line.
- Data blocks
- Some commands, like BarData, PlotData, TextData, Colors expect a data block consisting of one or more data lines. Data lines should start with one or more spaces. A data block is considered complete when a line starting with a non-space is encountered (exception: empty lines are ignored, they may be used to group related data lines within a block).
- Attributes in a data block can conceptually be divided into parameters and data items. Data blocks can contain parameters and data items intermingled.
- Data items
- In data lines attributes text, from, till and at always apply only to the line in which they occur.
- Parameters
- In data lines attributes like color and fontsize have different implications depending on the context. If these parameters occur on a line without data items, they set new defaults for the data lines that follow. If they appear on a line mixed with data items they apply only to that line, thus overruling a default that was previously set.
Example:
# In this example two sets of bars are drawn, in red and blue respectively,
# but in each set one bar (marking war periods) will be drawn in green.

PlotData =
  color:red fontsize:S                               # set defaults
  bar:USSR from:1919 till:1922 text:Lenin            # red bar
  bar:USSR from:1922 till:1953 text:Stalin           # red bar
  bar:USSR from:1939 till:1945 text:WWII color:green # green bar
  bar:USSR from:1953 till:1964 text:Krushchev        # red bar

  color:blue                                         # change default color
  bar:US from:1913 till:1921 text:Wilson             # blue bar
  bar:US from:1917 till:1918 text:WWI color:green    # green bar
  bar:US from:1921 till:1923 text:Harding            # blue bar

#> this multiline comment does not end command PlotData,
   even when the previous line does not start with a space<#

   bar:US from:1923 till:1929 text:Coolidge           # blue bar

TextData =                                            # now PlotData is considered complete
   tabs:...etc
Attribute data input rules[edit]
Measurements[edit]
Measurements can be absolute or relative to the image size depending on the unit specified in attributes. In attributes that take coordinate pairs, the first coordinate is horizontal from left to right, the second is vertically upward.
Absolute measures[edit]
They may be used for specifying total sizes of the image, positions and position shifts. The value can be specified in pixels (px), inches (in) or centimeters (cm) by appending a postfixed unit to the value. Values can have fractional decimals.
Example:
PlotArea = left:50 bottom:50 right:50 top:90
The following absolute measures are equivalent:
800px800(the default unit is the pixel)8in(assuming a display resolution of 100 pixels per inch)3.15cm(assuming the same display resolution, converted to centimeters)
Relative measures[edit]
They may be used for specifying sizes and positions according to the total image sizes; they can't be used for specifying the total image sizes (see ImageSize) but may be used to define the PlotArea.
For horizontal measurements the percentage is related to image width, for vertical measurements to image height.
Specify a number between 0 and 100, immediately followed by a % (percentage) sign.
Example:
PlotArea = left:10% bottom:5% right:5% top:15%
Text input[edit]
Text input is subject to a few rules:
- Only a subset of Unicode is allowed for font rendering, but Unicode in links should work for all characters. See also Font support.
- When text should contain spaces, either specify these by using underscores (_) or place the text between "double quotes".
- Exception: when the text attribute is the last attribute on a line, spaces are allowed (no confusion will arise where the text stops and the next attribute starts, that is—to be precise—when no colons occur in the text).
- In data lines following command TextData two characters have special meaning:
- ^ (caret) means tab
- ~ (tilde) means newline
Example: (the following are all equivalent)
BarData =
  text:Japanese_mandate_since_1914 bar:Marshalls

BarData =
  text:"Japanese mandate since 1914" bar:Marshalls

BarData =
  bar:Marshalls text:Japanese mandate since 1914
Example showing tabs:
TextData =
  tabs:(4-right,12-right,14-left,34-left)
  text:^1^1940^27/9^Berlin Ger,It,Jap sign Tripartite Pact
  text:^10^1944^1-22/7^Bretton Woods 44 nations establish
  text:^^^^^IMF and World Bank

# will be shown as:
#
#      1    27/9 Berlin Ger,It,Jap sign Tripartite Pact
#     10  1-22/7 Bretton Woods 44 nations establish
#                                    IMF and World Bank
Clickable maps[edit]
Both output formats available in MediaWiki, i.e. PNG and SVG, can contain clickable links. Texts shown in blue, and bars, may then be clicked, to surf to another web page.
Links can be specified with commands BarData, PlotData and TextData, either with attribute link, or as embedded links, via attribute text.
Embedded links[edit]
Embedded links are links that are (part of a) displayable text, specified with attribute text. Their counterpart are explicit links (URL only) which are defined with attribute link.
Both type of links can be specified with commands BarData, PlotData and TextData and are used for clickable maps.
In embedded links, internal link style is as usual, interwiki link style does not work, external link style is as usual with single brackets, but here with a pipe instead of a space.
Examples:
text:example [[Help:Link]] internal link
will be shown as:

text:[[Help:Link|Link]]
will be shown as:

text:[http://en.wikipedia.org/wiki/Rembrandt|Rembrandt van Rijn] paints Night Watch
will be shown as:

Using interwikis[edit]
An attempt to use interwiki link style:
text:[[en:Main Page]]
and similar with nl: and m: gives:


The third one to Meta-Wikipedia works properly, except from Meta itself, the other links work like Main Page (internal page, the prefix is ignored) or e.g. //www.mediawiki.org/w/Main_Page (gives File not found), depending on the URL of the referring page (e.g. different for a preview page and a diff page).
Special characters[edit]
- #, #>, <# (hash, hash+"greater than", "less than"+hash): see Comments
- ~ (tilde) in texts means: line break
- ^ (caret) in texts means: tab
- _ (underscore) in texts means: space
- $ (dollar sign) precedes any user defined constant
Blank spaces and underscores in a url should be written as %20.
The tilde character (~) is normally interpreted as line break. When a tilde is part of a url write it as is two tildes.
For example, link to www.site.com/~mysite as:
text:[www.site.com/~~mysite|My site]
The number sign (#) is normally interpreted as start of comment. When a number sign is part of an url make sure the text is embedded in double quotes as follows:
text:"More at [www.site.com/~~mysite#section2|My site]"
Actually it may be a good idea to always put texts between double quotes.
Command Reference[edit]
For each command the valid attributes are listed. Some commands are mandatory, and some attributes in commands are optional.
For some commands certain attributes are mutually exclusive (will be explained where applicable).
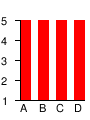
AlignBars[edit]
Bars will always be drawn at equal distances. This command specifies whether the bars should be spaced as much apart as possible, or some white space should be reserved between the left/top side of the chart and the first bar or between the last bar and the right/bottom side of the chart.
- early (default)
- The first bar will be placed on the leftmost/topmost position of the chart ('glued' to the axis), leaving space between the last bar and right/bottom side of the chart.
- late
- Opposite from early: the last bar will be placed as far to the right/bottom side of the chart as possible, leaving space between the axis line (left/top side of chart) and the first bar.
- justify
- The first and last bars will be placed as far apart as possible, leaving no empty space on either side of the chart. When only one bar is present, justify will be interpreted as "centered".
The exact alignment depends on the orientation setting in the TimeAxis mandatory command.
Examples:
| Alignbars = | early | late | justify | (default) |
|---|---|---|---|---|
| TimeAxis = orientation:horizontal |
 |
 |
 |
 |
| TimeAxis = orientation:vertical |
 |
 |
 |
 |
BackgroundColors[edit]
This command allows the specification of background colors for various parts of the chart. Any color-ids specified should be defined first using Colors.
- canvas:color-id (optional)
- Specify a background color for the whole image.
- bars:color-id (optional)
- Specify a background color for all bars.
Examples:
BackgroundColors = bars:darkgrey

BackgroundColors = canvas:lightgrey bars:darkgrey

BackgroundColors = canvas:lightgrey
BarData[edit]
This is an optional command which if present determines which bars will be drawn on the chart and in which order. If it is omitted then bars will be drawn in order of their appearance in command PlotData.
For complex timelines with many bars, usage of this command is recommended:
- It will ease reordering of the displayed data.
- Bar names specified in PlotData can be validated against this list, thus preventing typing errors.
- bar:bar-id (optional)
- Defines the bar id. Other commands (notably PlotData) will expect this id for reference. This will also be the label to be shown along the axis, unless attribute text is present. The bar id should not contain any spaces: use underscores instead, these will be converted to spaces, as with article titles.
- bar:barset-id (optional)
- Specifies the barset id to be used for other commands. Like the bar id, underscores should be used as opposed to spaces.
- text:some_text (optional)
- When specified this specifies the text to be presented along the axis, instead of the bar id. See also rules for text input. The text may include one embedded link (see Note 1).
- link:local-URL (optional)
- Specify a web link (see Note 1) (URL). The label along the axis will be shown as a blue clickable link.
Notes
- Either use attribute link, or an embedded link in attribute text, not both.
Examples:
BarData =
  bar:Japan
  bar:US       text:"United States"  # refer in PlotData to bar "US" but show "United States"
  bar:China    text:[[China]]        # label China will be shown as blue clickable link to the English Wikipedia article about China
The following lines produce the same output (only reference in PlotData changes):
bar:US            text:[[United_States]]

bar:US            text:"United States" link:http://www.wikipedia.org/wiki/United_States

bar:United_States                      link:http://www.wikipedia.org/wiki/United_States
Colors[edit]
This command allows colors to be defined and coupled to an id (identification tag). Other commands will refer to colors with the id specified here. This command expects one or more color definitions, each on a separate indented line.
- id:color-id
- Other commands will use this id to specify text, bar or background colors.
- value:color-space(coordinates)
- Actual color definition. Color values can be either be specified as:
- predefined-color-name: 32 color constants are predefined and recognized (see the Ploticus color page where all these constants are defined).
- rgb(red,green,blue): specify 3 numbers between 0 (minimal) and 1 (maximal)
- hsb(hue,saturation,brightness): specify 3 numbers between 0 and 1.
- gray(value): specify a number between 0 (black) and 1 (white).
- Notes
- 0 and 1 colorspace coordinates must be specified as integers only, intermediate coordinates require a dot as the decimal separator after 0.
- To create RGB or HSV colors please see RGB/HSB Color converter
- Hexadecimal to rgb()
- To convert from hexadecimal (#D09916) to rgb (rgb(0.816,0.600,0.086)):
- Visit ColorHexa, and search for your hexadecimal colour.
- Read the line of text at the start along the lines of "In a RGB color space, hex ... is composed of RR.R% red, GG.G% green and BB.B% blue".
- Divide the three numbers (RR.R, GG.G and BB.B) by 100, and use the resultant number (between 0 and 1) as the values for rgb().
- To convert from hexadecimal (#D09916) to rgb (rgb(0.816,0.600,0.086)):
- legend:some_text (optional)
- Specifies the text that should be displayed in the legend for this color. If this attribute is omitted no entry will appear in the legend at all.
- Notes:
- See Text Input for rules.
- Embedded links are supported in legend texts, see Clickable maps.
Example:
Colors =
  id:war       value:red   legend:War_Period
  id:peace     value:blue  legend:Peace_Time
  id:treaty    value:rgb(0.6,0,0.6)
  id:lightgrey value:gray(0.9)
  id:darkgrey  value:gray(0.1)
Predefined colors[edit]

Reference to Colors in HTML[edit]
| #000000 | #b29999 | #e5d3c9 | #ffffff | |||
| #ffcccc | #ff9999 | #ff4c7f | #b24c4c | #ff0000 | #dc143c | |
| #ff7f00 | #ff9e23 | #ffcc99 | #ffd800 | #eaea00 | #ffff00 | #ffe599 |
| #00ff00 | #00b200 | #4c994c | #007f33 | #99cc99 | #99e599 | #ccffb2 |
| #b2ccff | #007fcc | #0066cc | #0000ff | |||
| #770077 | #aa4caa | #9999ff | #b2b2ff | #ccb2cc |
DateFormat[edit]
This command defines how dates, specified in other commands, should be interpreted.
Valid date formats are:
- dd/mm/yyyy (dates in most English-speaking countries)
- Dates are interpreted as day/month/year
- Note: this format is only allowed for dates starting from 01/01/1800
- mm/dd/yyyy (dates in US)
- Dates are interpreted as month/day/year
- Note: this format is only allowed for dates starting from 01/01/1800
- yyyy (this is the default format)
- This deals with integers from -9999 to 9999 without leading zeroes
Note that the following formats are still not supported:
- the ISO 8601 standard format: yyyy-mm-dd (standard in Canada).
- the alternate Central-European standard format: yyyy.mm.dd.
- the date formats with month but without day: mm/yyyy or ISO 8601 yyyy-mm.
- the date formats with quarters: qq/yyyy or ISO 8601 yyyy-Qq.
- other date element separators, multilingual abbreviated month names...
Example:
DateFormat = mm/dd/yyyy
Define[edit]
This command allows definition of text constants, i.e. shorthands for pieces of script code that occur multiple times. Text constants should always start with a $ (dollar sign).
Example:
Define $broad       = width:30
Define $narrow      = width:10
Define $bardefaults = $broad fontsize:S
ImageSize (mandatory)[edit]
This command defines the overall size of the final image. Specify values in absolute measurements.
- width:pixels/auto
- Width of final image in pixels: maximum is 1600 pixels, minimum is 25
- (can also be set to auto if the TimeAxis direction is set to vertical).
- height:pixels/auto
- Height of final image in pixels: maximum is 1200 pixels, minimum is 25
- (can also be set to auto if the TimeAxis direction is set to horizontal).
- barincrement:pixels
- Amount in pixels that should be added to the image size for each bar specified
- (only allowed in combination with width:auto or height:auto, and then mandatory).
For maximum flexibility you can let the script calculate the height or width of the image, based on the number of bars and the amount in pixels to add per bar. Specify height:auto (for horizontal time axis) or width:auto (for vertical time axis).
This is especially helpful when the number of bars in a timeline is likely to change over time again and again. Or to ensure equal distances between bars in images with many narrow bars where differences in amount of white space would soon be noticed (see for a real example :en:Template:Vocal and instrumental pitch ranges). Or to make sure several related timelines always use the same distance between bars, no matter how many bars each contains (see for a real example :en:List of popes (graphical). In short it is a good idea most of the time.
Examples:
ImageSize = width:800 height:600

ImageSize = width:800 height:auto barincrement:30
Legend[edit]
A legend will only be shown when this command is present, and at least one of the colors has the legend: attribute specified.
There are several ways to define the appearance and position of the legend. Some attributes are mutually exclusive (see below).
- orientation:hor/ver (optional)
- Specify hor[izontal] or ver[tical] (default).
- restriction: orientation = 'horizontal' and position = 'right' are mutually exclusive
- position:top/bottom/right (optional)
- Defines placement of the legend relative to the chart area. Specify top, bottom (default) or right.
- restriction: orientation = 'horizontal' and position = 'right' are mutually exclusive
- columns:integer (optional)
- Specify 1, 2, 3 or 4.
- When this attribute is omitted the number of columns is determined as follows:
- orientation horizontal: Attribute columns does not apply here. All entries will be on the same line.
- orientation vertical:
- position right: All entries will be in one column
- position top or bottom: The number of columns depends on the number of entries to be shown:
1-5 entries: 1 column, 6-10 entries: 2 columns, 11 or more entries: 3 columns.
Tip: you may consider omitting the following parameters at first, and only add them when defaults settings are not satisfactory.
- columnwidth:distance (optional)
- Defines the distance between columns. You can specify an absolute distance or a relative distance (as percentage of the image width).
- restriction: this parameter is ignored when columns = 1 is defined or implied.
- left:distance (optional)
- Defines the distance between the left side of the legend and the left side of the image. You can specify an absolute distance or a relative distance (as percentage of the page width).
- top:distance (optional)
- Defines the distance between the top of the legend and the bottom of the image. You can specify an absolute distance or a relative distance (as percentage of the page height).
Examples:
Legend = orientation:vertical position:bottom columns:3 columnwidth:140

Legend = orientation:horizontal position:bottom

Legend = left:100 top:120 columns:3
LineData[edit]
Some timelines extend over several clearly distinct periods. A line demarcating these periods may serve as a visual aid.
- at:time
- Draws a line perpendicular to the time axis (between minimum and maximal positions, see also below).
- Specify the date/year where the line should be drawn, in compliance with the specified DateFormat.
- color:color-id (optional)
- Specify the color in which the line should drawn.
- Note: The color id specified should be defined first with command Colors.
- layer:front/back (optional)
- Specify front or back (default). Defines whether the line should appear in front of or behind all time segment bars.
- width:distance (optional)
- Specify value between 0.1 (very thin) and 10 (very thick); the default value is 1
Advanced positioning options
You can draw lines in any direction. Only in rare cases the following extra attributes may be needed for full flexibility:
- Parallel to the time axis with arbitrary start and stop times:
- atpos:position
- from:time (optional)
- till:time (optional)
- Specify the absolute or relative position on the axis orthogonal to the TimeAxis.
- Specify the dates/years between which the line should be drawn, in compliance with the specified DateFormat (default is the full range of time as set in the mandatory Period command, see also below).
- Orthogonal to the time axis with arbitrary start and stop positions:
- at:time
- frompos:position (optional)
- tillpos:position (optional)
- Specify the date/year where the line should be drawn, in compliance with the specified DateFormat.
- Specify the start and stop absolute or relative positions on the axis orthogonal to the TimeAxis (default is the full length of the DrawArea).
- Draws a line orthogonal to the time axis (default at full range of time as set in the mandatory Period command, see also below).
- In any direction with arbitrary start and stop points:
- points:(x1,y1)(x2,y2)
- Specify the absolute or relative positions as coordinates, independently of the direction of the time axis.
Example:

LineData =
  layer:front                                            # all lines in front of bars unless stated otherwise
  at:1                         color:yellow              # perpendicular to time axis full length
  at:2                         color:orange  layer:back  # perpendicular to time axis full length but behind bars
  at:4  frompos:50 tillpos:105 color:green               # perpendicular to time axis, with specified start and stop points
  from:5 till:8 atpos:50       color:red                 # parallel to time axis
  points:(100,20)(170,105)     color:blue    width:3     # from one arbitrary absolute position to another, extra thick
Period (mandatory)[edit]
Defines the time period that will be displayed in the chart. Both parameters are mandatory. Specify dates in compliance with specified DateFormat.
- from:time
- Timeline starts here. The specified value can be referenced as start in commands like PlotData and TextData.
- till:time
- Time ends here. The specified value can be referenced as end in other commands.
Example:
Period = from:01/09/1939 till:02/09/1945
PlotArea (mandatory)[edit]
- left:distance
- Margin between left side of image and left side of plot area. Specify value in absolute or relative measurements.
- top:distance
- Margin between top of image and top of plot area. Specify value in absolute or relative measurements.
- right:distance (recommended)
- Margin between right side of image and right side of plot area. Specify value in absolute or relative measurements.
- This attribute and the deprecated width attribute are mutually exclusive.
- bottom:distance (recommended)
- Margin between bottom of image and bottom of plot area. Specify value in absolute or relative measurements.
- This attribute and the deprecated height attribute are mutually exclusive.
- The minimum value for this attribute is 20 pixels if you have specified legend labels (see Legend).
width:distance (deprecated)- Specify value in absolute or relative measurements.
- do not use anymore, see the right attribute above.
height:distance (deprecated)- Specify value in absolute or relative measurements.
- do not use anymore, see the bottom attribute above.
Notes:
- The width and height attributes are only retained for downward compatibility. Earlier a plot area could only be defined by its total width and height, and left and bottom margins.
- Now you can specify all four margins, and are advised to do so, and not use width and height attributes anymore.
- The advantage is added flexibility: when you change the overall image size, you do not need to adjust the plotarea definition as well. This is even more important when the image size is calculated automatically (see ImageSize).
Example:
PlotArea = left:40 bottom:60 top:10 right:10 # e.g. extra space to the left and below the plot area for axis labels and legend
PlotData[edit]
Used to define bars (symbolizing a time period), and add text next to these bars on a specific position.
For texts which are not related to a certain period or date/year or which require extensive formatting use command TextData.
Attributes text, at, from and till always apply only to the line on which they occur. All other attributes, when not combined with one of these four, act as default for the remainder of the command block or until a new default is specified, and may be overruled for a single line. See Parameters vs data items for more info and an example.
PlotData accepts a lot of attributes, some of which are mutually exclusive. These attributes can be grouped as follows:
- Positional attributes
- Bar related attributes
- Text attributes
- Marker attribute
Positional attributes[edit]
- at:time (applies only to current line in data block)
- Specifies at which date/year a text or marker should be positioned. Depending on attribute align the text either starts, ends or is centered at this position. Use date/year format as specified in DateFormat or specify start or end which refers to time frame defined by command Period.
- Note: This attribute can not be combined with attributes from and till.
- from:time (applies only to current line in data block)
- till:time (applies only to current line in data block)
- Specifies at which date/year a bar should start and end. Use date/year format as specified in DateFormat or specify start which refers to time frame defined by command Period.
- Note: These two attributes should be used in combination and can not be combined with attribute at.
- shift:(x,y) (optional)
- Specifies a horizontal and vertical displacement in absolute measurements for a text. This allows:
- Texts to be shifted to avoid overlaps between successive bars;
- Placement of text beside a bar, instead of on top of it.
Examples:
PlotData=
  bar:Japan from:start      till:19/02/1945 color:JT
  bar:Japan from:19/02/1945 till:14/03/1945 color:AI
  bar:Japan from:02/09/1945 till:end        color:AO

  at:07/12/1941 shift:(0,-15) text:"<-- WW2 reaches Asia"
[edit]
- bar:bar-id
- Specifies to which bar all other attributes apply (including the optional marker attributes and text attributes).
- The bar-id specified here will also be the text presented along the axis, next to the bar.
- When command BarData has not been used, bars will be drawn in the order in which they occur in any PlotData data block.
- When command BarData has been used, bars will presented in the order specified there, also the bar-id specified here will be validated against that list. Also the text presented along the axis will depend on the definition in BarData.
- barset:barset-id (optional)
- Restarts the bar display "from the top", allowing multiple bars on the same line.
- The specified barset-id must have been declared in BarData.
- The default barset is anonymous and needs not be specified if there's no BarData.
- Blank lines may be added to skip over lines that you do not wish to add to with declarations such as
at:1234with no further attributes. Multiple bars may then be specified on after this attribute.
- color:color-id (optional)
- Specifies the color is which the bar should be drawn.
- The color id specified should be defined first with command Colors.
- The default value will be the same color as the previously specified bar.
- width:distance (optional)
- Specifies the width of the bar in absolute or relative measurements.
- The default value will be computed according to the total size of the PlotArea, and the maximum number of bars in all barsets (including the default anonymous barset).
Example:
BarData=
  bar:US text:United States
  bar:SB text:Sea Battles

Colors=
  id:US value:blue legend:United_States
  id:SB value:rgb(0.8,0,0.7) legend:Sea_Battles

PlotData=
  width:0.3                                                            # see note 1
  bar:SB     from:07/08/1942 till:09/02/1943 text:Guadalcanal color:SB # see note 2
  bar:US     from:start      till:end color:US                         # see note 3
  bar:Midway from:start      till:end color:US                         # see note 4
  bar:US     at:07/12/1941   text:7/12 Pearl Harbour                   # see note 5
Notes:
- this line establishes a default bar width for the remainder of the data block
- this line specifies a bar to be drawn and a text to placed on it at the same time
- bar US will be drawn before bar SB, even when specified after it, because command BarData determines the sequence
- bar Midway will be rejected because it is not declared with command BarData
- the last line will not result in a bar being plotted, it merely specifies on which bar the text should be placed
Text attributes (optional)[edit]
- text:some_text (applies only to current line in data block)
- Defines a text that should be plotted on or near a bar.
- Notes
- See also Text Input for rules.
- The text may include embedded links (see Notes 1 & 2) for use in clickable maps.
- See Clickable maps for information about texts with embedded links and limitations.
- textcolor:color-id (optional)
- Defines the color of the text. The color id specified should be defined first with command Colors. When not specified color black will be assumed.
- fontsize:integer/tag (optional)
- Specify a point size between 6 and 30, or (preferably) one of tags XS, S (default), M, L or XL. See Font support for more details.
- anchor:middle/from/till (optional)
- Specify the anchor position. If not defined, the anchor position is either explicitly set with the attribute at, or implicitly with the attributes from and till. In the latter case the text will be positioned in the middle of the defined bar segment.
- align:center/left/right (optional)
- Specify center (default), left or right.
- link:URL (optional, applies only to current line in data block)
- Specify a web link (see Note 1) (URL) for use in clickable maps. The text will be shown as a blue clickable link.
- Notes
- This attribute can only be used with the text attribute.
- Either use attribute link, or an embedded link in attribute text, not both.
- On PNG images rendered as clickable maps, only one clickable link will be shown per text segment: text with line breaks (~) constitutes several segments.
- See Clickable maps for information about texts with embedded links and limitations.
Example:
PlotData=
   bar:US at:07/12/1941 align:left textcolor:black fontsize:XS text:7/12 [[Pearl Harbour]]
produces the same result as:
PlotData=
   bar:US at:07/12/1941 align:left textcolor:black fontsize:XS text:"7/12 Pearl Harbour" link:http://www.wikipedia.org/wiki/Pearl_Harbour
Marker attribute (optional)[edit]
- mark:(symbol,color-id)
- Places a marker in a bar at the specified position.
- The only value for symbol supported to date is line.
- The color-id specified should be defined first with command Colors. When not specified color black will be assumed.
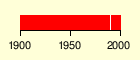
Example:
PlotData=
  bar:test width:15 color:red
  from:1900 till:2000
  at:1990 mark:(line,white)
will be shown as:
ScaleMajor[edit]
This command divides the timeline into smaller periods, either
- Graphically, through thin vertical or horizontal lines in the chart
- Textually, through stubs in the time axis, below or to the left of the chart
- Both graphically and textually
- gridcolor:color-id (optional)
- Defines the color for the grid lines.
- When this attribute is omitted no grid lines will be drawn.
- The color-id specified should be defined first with command Colors.
- unit:time-unit (optional)
- Specifies the time unit by which the grid spacing is incremented.
- Specify day, month or year (default).
- When DateFormat = yyyy is specified, only unit year is allowed.
- increment:integer (optional)
- Specifies the (non zero) number of units by which the grid spacing is incremented.
- The default increment is 1.
- start:time (optional)
- Specifies where the first grid line and/or stub should be displayed.
- Defaults to start of defined Period.
Note: the orientation of the lines and/or placement of the stubs depends on the orientation of the TimeAxis.
Examples:
ScaleMajor = gridcolor:red start:1940

ScaleMajor = gridcolor:red unit:month increment:3 start:01/09/1939
ScaleMinor[edit]
This command defines a further subdivision of the timescale (see ScaleMajor for attributes syntax).
Example:
ScaleMajor = grid:red  unit:year  increment:1 start:01/01/1940
ScaleMinor = grid:blue unit:month increment:3 start:01/10/1939
TextData[edit]
Used to define a text block that can be positioned anywhere on the chart.
- text:some_text
- The actual text.
- See also Text Input for rules.
- The text may include embedded links (see also Notes 1 & 2).
- pos:(x,y)
- Defines the top-left corner of the text block in absolute or relative measurements.
- link:URL (optional)
- Specify a web link (see Note 1) for use in clickable maps.
- The label along the axis will be shown as a blue clickable link.
- textcolor:color-id (optional)
- Defines the color of the text to draw.
- The color-id specified should be defined first using Colors.
- When not specified, the color is black.
- fontsize:integer/tag (optional)
- Specify a point size between 6 and 30, or (preferably) one of tags XS, S (default), M, L or XL (see Font support for more details).
- tabs:(x1-alignment1,x2-alignment2...) (optional)
- Defines position and alignment for tab character: ^ (caret).
- Specify multiple tab settings as a comma-separated list of xn-alignn where
- xn is the horizontal displacement in absolute measurements from the left side of the text;
- alignmentn is the alignment for the text segment (specify center, left or right).
- lineheight:distance (optional)
- Defines spacing between consecutive lines in absolute measurements.
- Specify a value up to 40 pixels (or 0.4in).
- When not specified a default lineheight will be based on the font size currently in use.
Notes:
- Either use attribute link, or an embedded link in attribute text, not both.
- On PNG images only one clickable link will be shown per text segment (text with tabs (^) constitutes several segments).
Example:
TextData =
  pos:(20,67) textcolor:black fontsize:S
  tabs:(10-right,14-left,50-left,90-left,230-left)
  text:^1^1940^27/9^Germany,Italy and Japan sign [[Tripartite Pact]]
  text:^10^1944^1-22/7^Bretton Woods 44 nations establish
  text:^^^^^IMF and World Bank
will be shown as:

TimeAxis (mandatory)[edit]
Defines the orientation of the time axis, and textual representation of stubs along that axis.
- format:time-format (optional)
- Specify in which format dates should be presented along the time axis.
- Currently only format yyyy (default) is supported. This means that if a the
unit:attribute for ScaleMajor is set to anything other thanyear, the major grid lines will not be in sync with the axis labels. For instance, settingunit:monthandincrement:6will result in major gridlines every 6 months, but axis labels every 6 years. Support for more formats may follow.
- orientation:hor/ver
- Specify hor[izontal] or ver[tical].
- The default time axis orientation is horizontal.
- order:reverse (optional)
- Specify reverse as the option to reverse the time flow.
- The default is the forward time flow.
Example:
TimeAxis = orientation:horizontal format:yyyy
Presets[edit]
Presets are a shorthand for often used settings. They save a few code lines and promote standardisation, but may be confusing, as the timeline script become less self documenting.
At the moment two presets are available:
- Preset = TimeVertical_OneBar_UnitYear, which expands to
PlotArea   = left:45 right:10 top:10 bottom:10
TimeAxis   = orientation:vertical format:yyyy
DateFormat = yyyy
AlignBars  = early
ScaleMajor = unit:year
ScaleMinor = unit:year
PlotData   =
   mark:(line,white) align:left fontsize:S width:20 shift:(20,0)
- Preset = TimeHorizontal_AutoPlaceBars_UnitYear, which expands to
ImageSize  = height:auto barincrement:20
PlotArea   = left:25 right:25 top:15 bottom:30
TimeAxis   = orientation:horizontal format:yyyy
Colors =
  id:canvas value:gray(0.7)
  id:grid1  value:gray(0.4)
  id:grid2  value:gray(0.2)
BackgroundColors = canvas:canvas
DateFormat = yyyy
AlignBars  = justify
ScaleMajor = unit:year grid:grid1
ScaleMinor = unit:year
Legend = orientation:vertical left:35 top:130
PlotData =
   align:left anchor:from fontsize:M width:15 shift:(4,-6) textcolor:black
Implementation and integration limitations[edit]
Font support[edit]
Timeline has somewhat limited Unicode support:
- it uses the FreeSans.ttf font, which supports a subset of all the possible glyphs ;
- for instance, it supports the West- and East-European diacritics for the Latin alphabet, as well as the Cyrillic, Greek and Armenian alphabets, the Hebrew abjad (but without visual reordering), the Devanagari, Bengali, Gurmukhi, Gujarati, Tamil and Kannara abugidas for Indian languages, the Kanas alphasyllabaries (for basic Japanese only), and a good subset of extended general punctuation, currency unit symbols, subscript/superscript digits, letterlike symbols, fractions and Roman numbers, some arrows and mathematical operators;
- but it lacks the Georgian alphabets, the Arabic abjad, the Hangul alphabet and syllables, the Oriya, Telugu Thai, Lao and Tibetan abugidas, the Kanji and Han ideographs (so Chinese, Korean, Georgian, Arabic and Thai are not supported, and Japanese must still be transliterated to basic Kanas or to Latin);
- also it does not support Dingbats, as well as non linguistic symbols like box drawing characters that should be drawn using the supported line drawing commands.
- Different fonts can be set in LocalSettings.php which may have better Unicode support. For example, the Malayalam Wikipedia uses a different font which has better Malayalam language support.

As a legacy of bitmap font usage, only five font tags are predefined. They will render at slightly different sizes in PNG and SVG images to produce optimal readability for both platforms. It is advised to use these tags instead of numbers whenever possible. They are: XS=eXtra Small, S=Small (default), M=Medium, L=Large, XL=eXtra Large

EasyTimeline code with template parameter or magic words[edit]
If you want to use easy timeline with template parameters or things like {{CURRENTDAY2}} you can use #tag syntax:
{{#tag:timeline|
Timeline code here
}}
However, one must replace all |'s with {{!}} (which should be a template containing just |).
See the section on #tag at Help:Magic words for details
Known bugs and limitations in embedded links[edit]
- You can currently specify only one link per text segment.
- Link trailers are not recognized, you must put the full text that is part of the link within "
[[]]". - Links that are not specified at the beginning of the text (or the beginning of a new line after a line break specified by a tilde) are incorrectly positioned (the normal text color is used at the correct position, and the text with the blue link color is overdrawn on top of it with the wrong horizontal position). See the first example trying to show "Help:Link" above in this section.
- If the displayed text in bar legends of a PlotData contains newlines (represented by a ~), the targer URL is broken, keeping only the first word in it.
For example the following code in bar data:
from:1935 till:2004 text:"[[Françoise Sagan|Françoise Quoirez,~alias Françoise Sagan]]" color:writer
currently renders as

where the target links to Françoise instead of Françoise Sagan, and shows the incorrect tooltip text "Françoise Sagan/.." with extra characters. This bug does not occur if the target link contains a single word. Surrounding the full text (with the link itself) with quotes does not solve the problem. Additionally, this requently causes the timeline to fail without showing the error during its rendering (no image rendered on the browser).
- In addition the target is assumed as belonging to the same parent page as the current subpage even though the target link does not start with a "/" (with the wiki syntax), so timelines containing links are not usable in subpages (like this one).
