Extension talk:Chartie

About this board

CSS for plot and dot

7
Simpsonspedia.net (talkcontribs)

.plot { stroke: #fc1; } .dot { fill: #eb0; }

https://simpsonspedia.net/index.php/Datei:Quoten_Staffel_33.csv

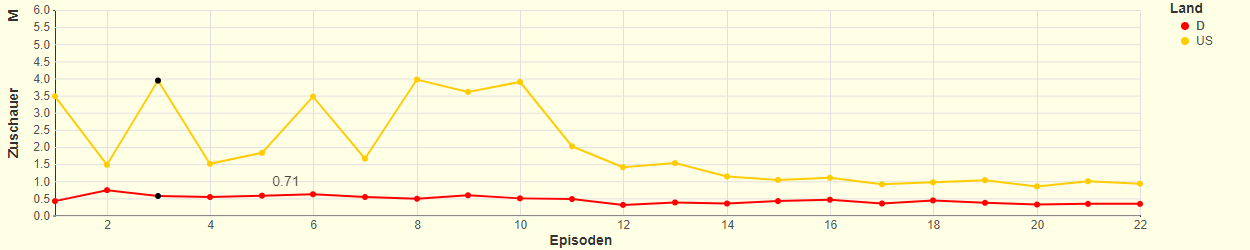
In this way both plots are of the same color. If I see it correctly, extensive adjustments would need to be made to the Chartie.js file.

In that case I would like the two plots to have different colors and the dots too. In the next step I would like to give all dots a different color at a fixed x value.

Martynov Maxim (talkcontribs)

By default, color is calculated using plot name hash, so for different plot names there should be different colors. As I see, one plot is yellow, and another is green. What adjustments are you talking about?

Simpsonspedia.net (talkcontribs)

screenshot: https://simpsonspedia.net/Chartie_01.png

Both plots are yellow. My CSS adjustment .plot { stroke: #fc1; } make all plots yellow.

By default first plot is rgb(149, 179, 0) and second plot is rgb(60, 179, 0). Both use the class "plot". I see no option to set a individual color for each plot.


If I changing CSS in my browser I can create my desired temporary result.

modified screenshot: https://simpsonspedia.net/Chartie_02.png

2 different individual colors and i. e. for the third episode all dots are black.

How and where do I need to make adjustments to achieve this end result?

Simpsonspedia.net (talkcontribs)

var color = intence("hsl(" + d.key.toString().hashCode() + ",100%,35%)", false);

var color = intence("hsl(" + name.toString().hashCode() + ",100%,35%)", false);

I added my simple color change to both. Not elegant, but it works.

// name = US

if (color == "rgb(149, 179, 0)")

{

color = "#fc1";

}

// name = D

if (color == "rgb(60, 179, 0)")

{

  color = "#c11";

}


Now all that’s missing is a solution for the black dot for a specific episode.

Martynov Maxim (talkcontribs)
Simpsonspedia.net (talkcontribs)

2 default colors != 2 individual colors

Martynov Maxim (talkcontribs)

If you want option to setup specific color for a curve, open a pull request in Github

Reply to "CSS for plot and dot"

Embedding the file doesn't work.

3
Simpsonspedia.net (talkcontribs)
Martynov Maxim (talkcontribs)

Could you give an example of such a page, and error you see? I don't see any issues with this file.

Simpsonspedia.net (talkcontribs)
Parzival1200 (talkcontribs)

How should the csv file be designed?

I have problems with the Data being displayed from a csv file.

Can I adjust the rows and colums used?

Martynov Maxim (talkcontribs)

Each row of CSV file should follow the format:

Name;x_value;y_value


Order of columns does matter. Other columns are ignored.

Reply to "CSV data design"
DGWKJacobs (talkcontribs)

Is it possible to make the width of the total chart including legend a percentage of the screen width? Auto doesnt quite work for me since it expands the screen to the right.

DGWKJacobs (talkcontribs)

I changed: chart[id].width  = Math.max(((window.innerWidth  !== 0) ? window.innerWidth  : screen.width )-220, 735); in Chartie.js. -220 set to -420 makes it fit the screen.

118.209.252.31 (talkcontribs)

Is it possible to set a max Y value? For context, I'm trying to use a percentage graph and fix y axis from 0 to 100, regardless of data values. Is this doable?

Thanks ---~~~~~

Martynov Maxim (talkcontribs)

For this moment it is not possible because extension does not provide a way for setting certain axis ranges. But you can contribute changes to add such functionality.

There are no older topics