
Extension:EasyTimeline
リリースの状態: 安定 |
|
|---|---|
| 実装 | タグ |
| 説明 | Adds <timeline> tag for creating timelines |
| 作者 | Erik Zachte |
| MediaWiki | >= 1.42 |
| データベースの変更 | いいえ |
| ライセンス | GNU 一般公衆利用許諾書 2.0 のみ |
| ダウンロード | CHANGELOG |
| 例 | 下記参照 |
|
|
| Public wikis using | 7,989 (Ranked 20th) |
| EasyTimeline 拡張機能の翻訳にご協力ください | |
| 問題点 | 未解決のタスク · バグを報告 |
| その他の言語: |
EasyTimeline(イージータイムライン)拡張機能はウィキ文から埋め込み画像を生成します。1次元(縦軸または横軸方向のみ)または2次元の画像です。
ヘルプページを参照してローカルに EasyTimeline をインストールします。 また EasyTimeline 公式のこのページも参考になり、test.wikipedia.org で試用できます。
この拡張機能が提供する構文のヘルプページをご参照ください。
There is a long-term effort to get the Graph extension to replace this extension.
要件
この拡張機能を利用するにはサーバに以下のプログラムがインストールされていることが前提です。
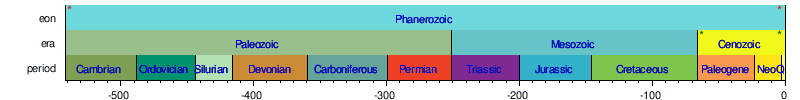
表の例
作成可能な表の例です。詳細は次をご参照ください。
- WW II - Pacific Theatre 太平洋戦争の展開 - 横位置
- :en:Timeline of aircraft carriers of the United States Navy アメリカ海軍の歴代の航空母艦 - 縦位置
- History of Computing 電子演算機の歴史 - 横位置
- Tour-de-France Sieger ツールドフランスの優勝者 - 縦位置
- Vocal and instrumental pitch ranges 声と楽器の音域 - 横位置(年表以外に使った例)
- Complete timeline of Macintosh models マッキントッシュの型番 - 横位置
- 単純な年表 :
- :en:Template:Extinction events graphical timeline 絶滅の歴史 - 横位置で、w:en:Template:Horizontal timelineテンプレートを使用
- :en:Talk:Invention_of_radio/Archive_1#Timeline.2C_Players ラジオ開発の関係者(アーカイブ) - 横位置で矢印入り
- :en:Template:Early evolution of the light bulb 電球の開発初期 - 縦位置
- :en:Invention of radio#Radio invention timeline ラジオの開発史 - 縦位置
- :en:Gaius_Marius#Timeline 人物の履歴 - 縦位置
- :en:User:Syed Atif Nazir/Template:Imam timeline イマームの時間 - 縦位置
- Population developement - horizontal
 |
    | |
 | ||
コードの例
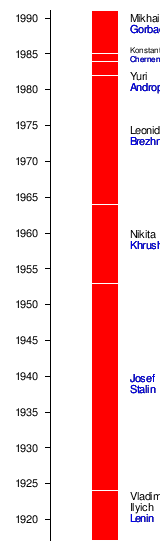
スクリプトの構文は容認できる程度には直感的で、スクリプトを使って表を示します : Soviet Leaders
<timeline>
# All measures are in pixels

ImageSize  = width:160 height:550
PlotArea   = left:50 right:0 bottom:10 top:10
AlignBars  = justify

DateFormat = yyyy
Period     = from:1917 till:1991
TimeAxis   = orientation:vertical
ScaleMajor = unit:year increment:5 start:1920

# there is no automatic collision detection,
# so shift texts up or down manually to avoid overlap

Define $dx = 25 # shift text to right side of bar

PlotData=
  bar:Leaders color:red width:25 mark:(line,white) align:left fontsize:S

  from:start till:1924 shift:($dx,15)   text:Vladimir~Ilyich~[[Special:MyLanguage/Lenin|Lenin]]
  from:1924  till:1953 shift:($dx,5)    text:[[Special:MyLanguage/Stalin|Josef~Stalin]]
  from:1953  till:1964 shift:($dx,5)    text:Nikita~[[Special:MyLanguage/Khrushchev|Khrushchev]]
  from:1964  till:1982 shift:($dx,5)    text:Leonid~[[Special:MyLanguage/Brezhnev|Brezhnev]]
  from:1982  till:1984 shift:($dx,-12)  text:Yuri~[[Special:MyLanguage/Andropov|Andropov]]
  from:1984  till:1985 shift:($dx,4)    text:Konstantin~[[Special:MyLanguage/Chernenko|Chernenko]] fontsize:XS
  from:1985  till:end  shift:($dx,10)   text:Mikhail~[[Special:MyLanguage/Gorbachev|Gorbachev]]
</timeline>
半角カッコの単数と複数 の使い分けはウィキペディア同様で、言語接頭辞も使えます。例えば [[de:foo|more about foo]]。外部リンクを示す単数の半角角カッコも使えます。
年表のすぐれた例をあちこちから
発想の源としてすばらしいサイトを2件紹介し、ほとんどの年表は苦労なく文字単位で再作成が可能で あり、見た目のレイアウトはほぼ EasyTimeline そっくりで(画像部分は改善待ち)、ただし実現は〈しない〉予感がします。
- Hyperhistory とは、ボタン配置を〈people〉が左、〈special lifelines〉が右。
- 希望的には1年以内に [1] みたいなセット(地図の全体表示にfull size image ボタン)の開発と、もしかしたら画像にも応用できると期待しています。注力する点はここにあげた各点を盗まずに情報を収集することです(地図の大部分はブリタニカ百科事典のデータに特異的に依存)。
Unicode
EasyTimeline はまだ Unicode をサポートしていません。
2004年8月:UTF-8 の最低限のサポートを導入し EasyTimeline でも UTF-8 形式の文字を認識可能になる。ただし右書き・左書きもしくは縦書きか、あるいは複雑なスクリプトへの対応は大幅に不足。既定のフォントが備えるグリフに非対応の文字がある。そこで代替フォントは $wgTimelineFontFileで指定できる。
SVGをPNGに変換
右横書き言語(RTL=アラビア語、ペルシャ語、ヘブライ語ほか)で正しく表示するには <timeline>timeline コード</timeline> の代わりに <timeline method="svg2png">timeline コード</timeline> を使用します。 年表は表示されるものの、リンクは無効化されます。
ヒント
初学者にとって EasyTimeline はかなり複雑に見えるかもしれません。 スクリプト言語にありがちなように、慣れが必要です。どの構文も記述がとても長く、気持ちが落ち込むかもしれません。幸運にも、スクリプト言語のほとんどの要素はオプショナルです。
EasyTimeline の〈Easy〉(簡単)が何を意味するかというと、これのインストールが終わって年表ができると、理解も実行も訂正もあまり難しくない点です。また他のウィキペディアで使うために翻訳するのも、かなりの確率で直訳で通せます。
ヒント集:
- 皆さんの目指す表に使えそうなものを探すには、表のサンプルをご参照ください
- 年表単位でテンプレートを作ります。プレビューがすぐに表示され、編集がしやすく、また複数ページへの導入がしやすくなります。
現在時刻を使用する
現在時刻の表示には、必ず表の冒頭に {{#tag:timeline| と書き、}} で閉じます。
次に現在時刻はマジックワードを使って挿入します。
たとえば{{#time: d/m/Y }} でも、{{CURRENTDAY2}}/{{CURRENTMONTH2}}/{{CURRENTYEAR}} でも、 日付の書式は dd/mm/yyyy(日月年)となります。
関連項目
- EasyTimeline コード
- ウィキマニア2005における EasyTimeline の発表(概要、スライド集、発表者による注釈)。
- m:WikiTimeScale ではウィキペディアの外部でタイムスケールを実現する方法を提言。
- w:Template:Simple Horizontal timelineはウィキペディアでもっと使いやすい年表。
- Extension:Graph
インストール
インストール節を参照してください
外部リンク
- SIMILE Widgets - DHTML-based AJAXy widget for visualizing time-based events
| この拡張機能は 1 つ以上のウィキメディアのプロジェクトで使用されています。 これはおそらく、この拡張機能が安定していて高いトラフィックのウェブサイトでも十分に動作することを意味します。 この拡張機能がインストールされている場所を確認するには、ウィキメディアの設定ファイル CommonSettings.php および InitialiseSettings.php 内で、この拡張機能の名前を探してください。 特定のウィキにインストールされている拡張機能の完全な一覧は、そのウィキの Special:Version ページにあります。 |
| この拡張機能は以下のウィキ ファーム/ウィキ ホスト/パッケージに含まれています: これは正式な一覧ではありません。 一部のウィキ ファーム/ウィキ ホスト/パッケージは、ここに記載されていなくてもこの拡張機能を含んでいる場合があります。 必ずご利用のウィキ ファーム、ウィキ ホスト、バンドルで確認してください。 |
- Stable extensions/ja
- Tag extensions/ja
- GPL licensed extensions/ja
- Extensions in Wikimedia version control/ja
- ParserFirstCallInit extensions/ja
- All extensions/ja
- Graphical Timelines/ja
- Extensions used on Wikimedia/ja
- Extensions included in Fandom/ja
- Extensions included in Miraheze/ja
- Extensions included in ShoutWiki/ja
- Extensions included in WikiForge/ja